How Much Energy Does a 3, 6 or 10 kW Solar System Produce in 2025?
Knowing how much energy your solar system can realistically produce is essential because this number directly determines your annual savings, ROI and level of energy independence. Moreover, when you understand the real output of a system, you can size it correctly without overspending or installing insufficient capacity.
Solar production in 2025 is higher than in previous years thanks to more efficient modules, better inverters and increasingly favorable climatic conditions across Italy. Consequently, modern installations typically perform better in real-world conditions and maintain stable production over the years. In this guide, we analyze 3, 6 and 10 kW systems using official PVGIS data published by the European Commission.
Real Production Across Italy: North, Center and South
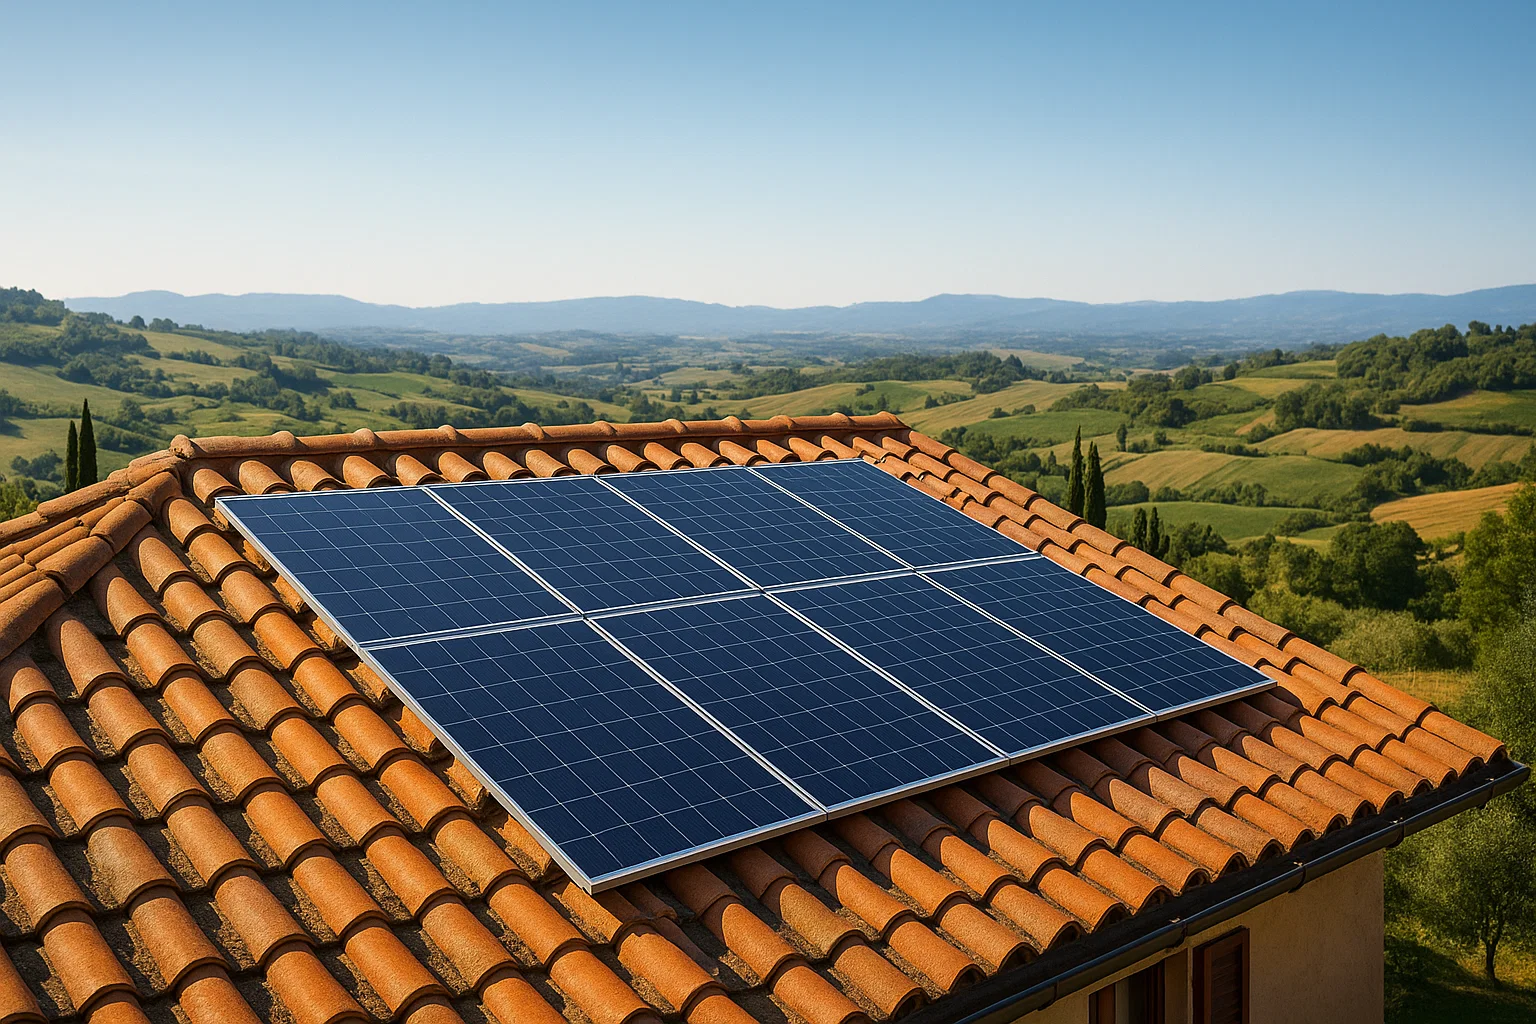
Italy is one of the sunniest countries in Europe, although the difference between regions is considerable. Northern Italy tends to experience greater seasonal variability, Central Italy shows more balanced performance and Southern Italy enjoys consistently higher irradiation. Therefore, geographic position plays a crucial role in real-world photovoltaic production.
Here are the official PVGIS 2025 averages calculated under ideal conditions (south-facing roof, 30° tilt, no shading):
3 kW System
• Northern Italy: 3,200–3,600 kWh/year
• Central Italy: 3,600–4,300 kWh/year
• Southern Italy: 4,300–4,800 kWh/year
6 kW System
• Northern Italy: 6,400–7,200 kWh/year
• Central Italy: 7,200–8,600 kWh/year
• Southern Italy: 8,600–9,400 kWh/year
10 kW System
• Northern Italy: 10,500–12,000 kWh/year
• Central Italy: 12,000–14,000 kWh/year
• Southern Italy: 14,000–15,500 kWh/year
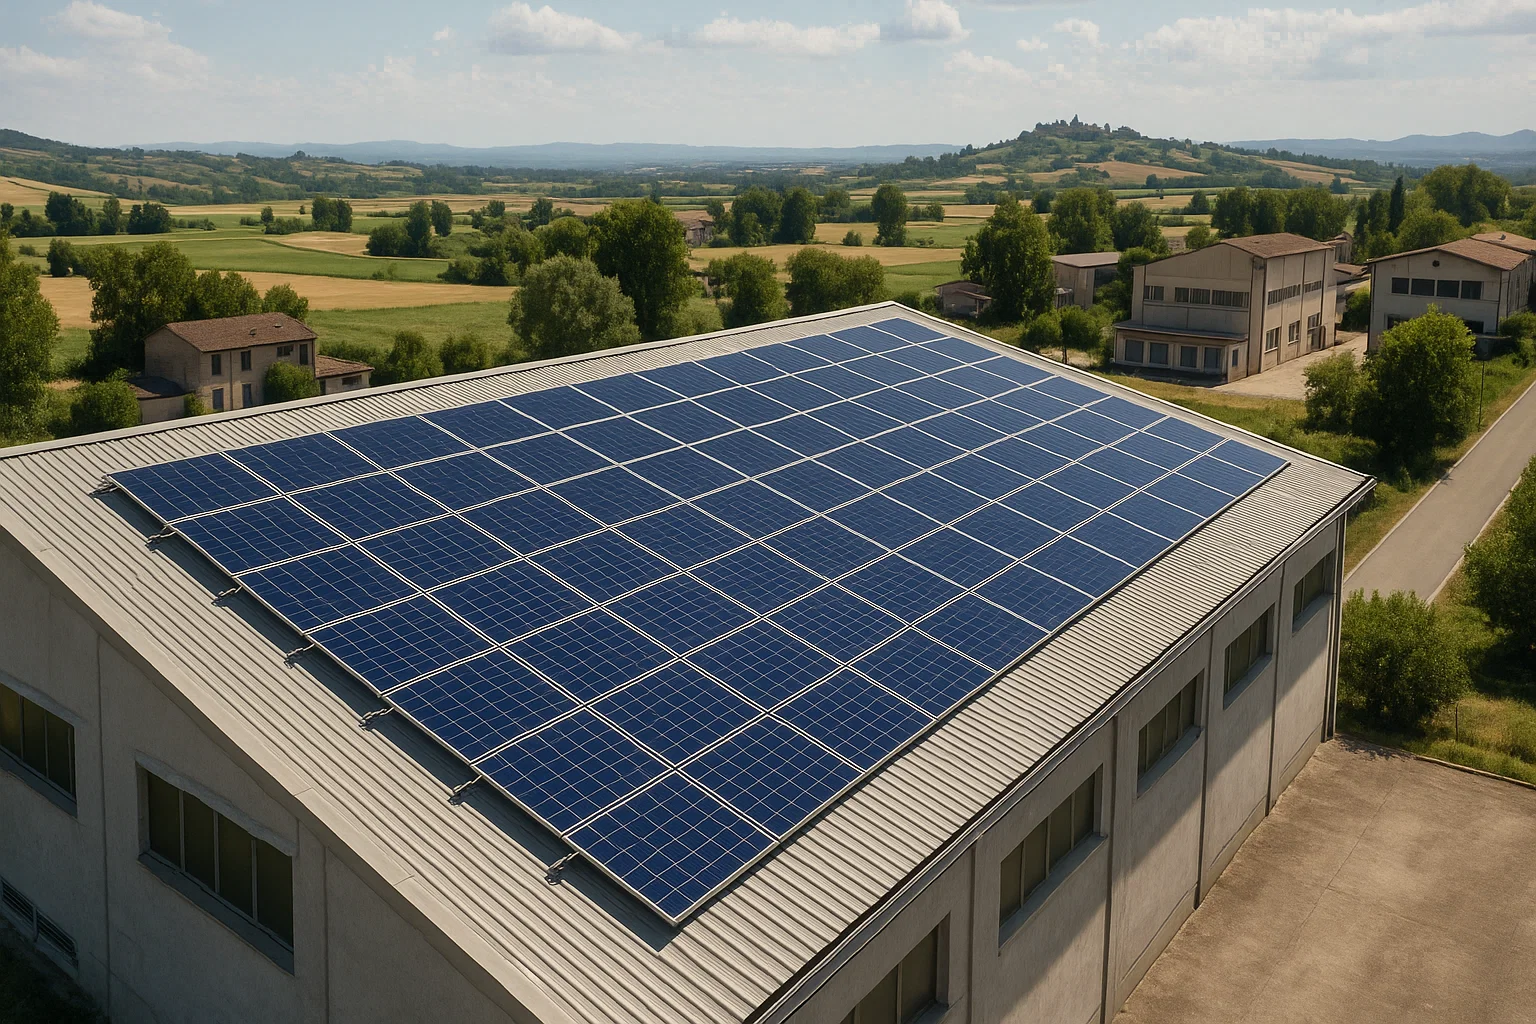
Why Modern Solar Systems Produce More Energy
Solar technology has improved dramatically in the last decade. Today’s systems often generate 15–20% more energy than older installations due to higher panel efficiency, smarter inverters and improved thermal behavior in hot climates. Additionally, modern MPPT algorithms maximize production under variable sunlight, and optimizers minimize losses caused by partial shading.
N-TYPE photovoltaic modules also retain their efficiency more effectively over time, ensuring stable long-term performance. For this reason, ROI continues to improve year after year, especially when a well-sized battery is included in the system.
The Factors That Influence Real Solar Production
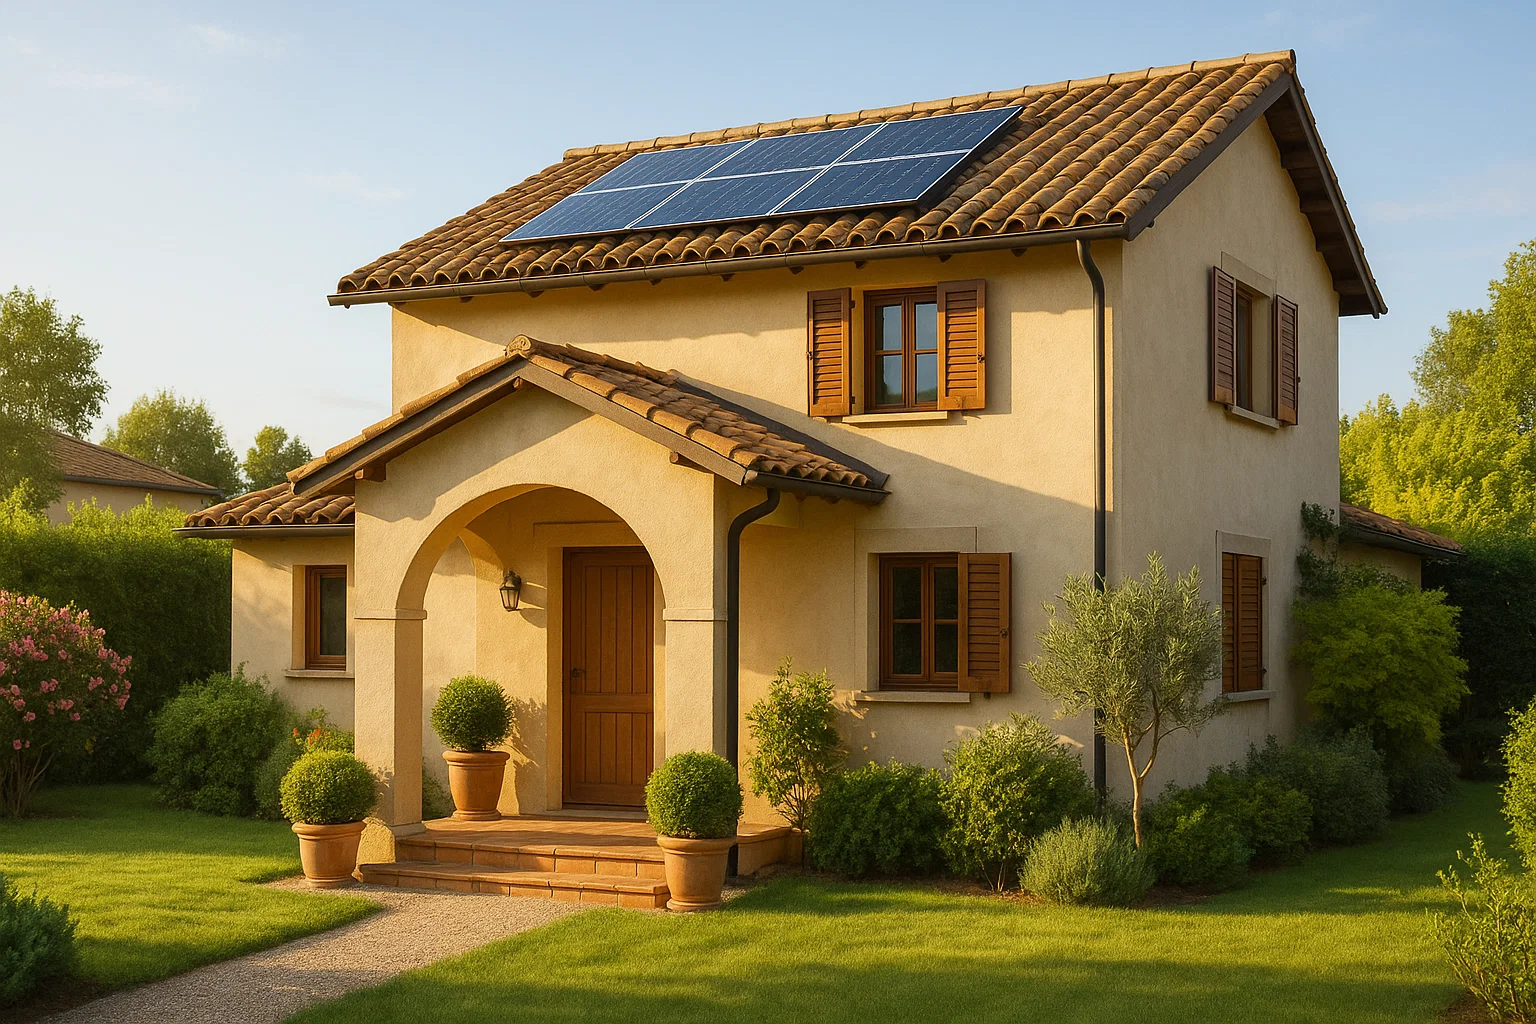
Although PVGIS provides extremely accurate estimates, the actual production of your system can vary based on several real-world conditions. First, roof orientation plays a crucial role. A south-facing roof offers the highest performance, while east- or west-oriented roofs produce slightly less but still achieve excellent annual yields. In contrast, north-facing roofs are not recommended.
Secondly, shading must be considered carefully. Even partial or temporary shadows—from trees, chimneys, antennas or nearby buildings—can reduce daily and yearly production. However, modern optimizers and N-TYPE panels significantly limit these losses, ensuring stable output even in complex environments. For this reason, most modern systems perform far better than older installations.
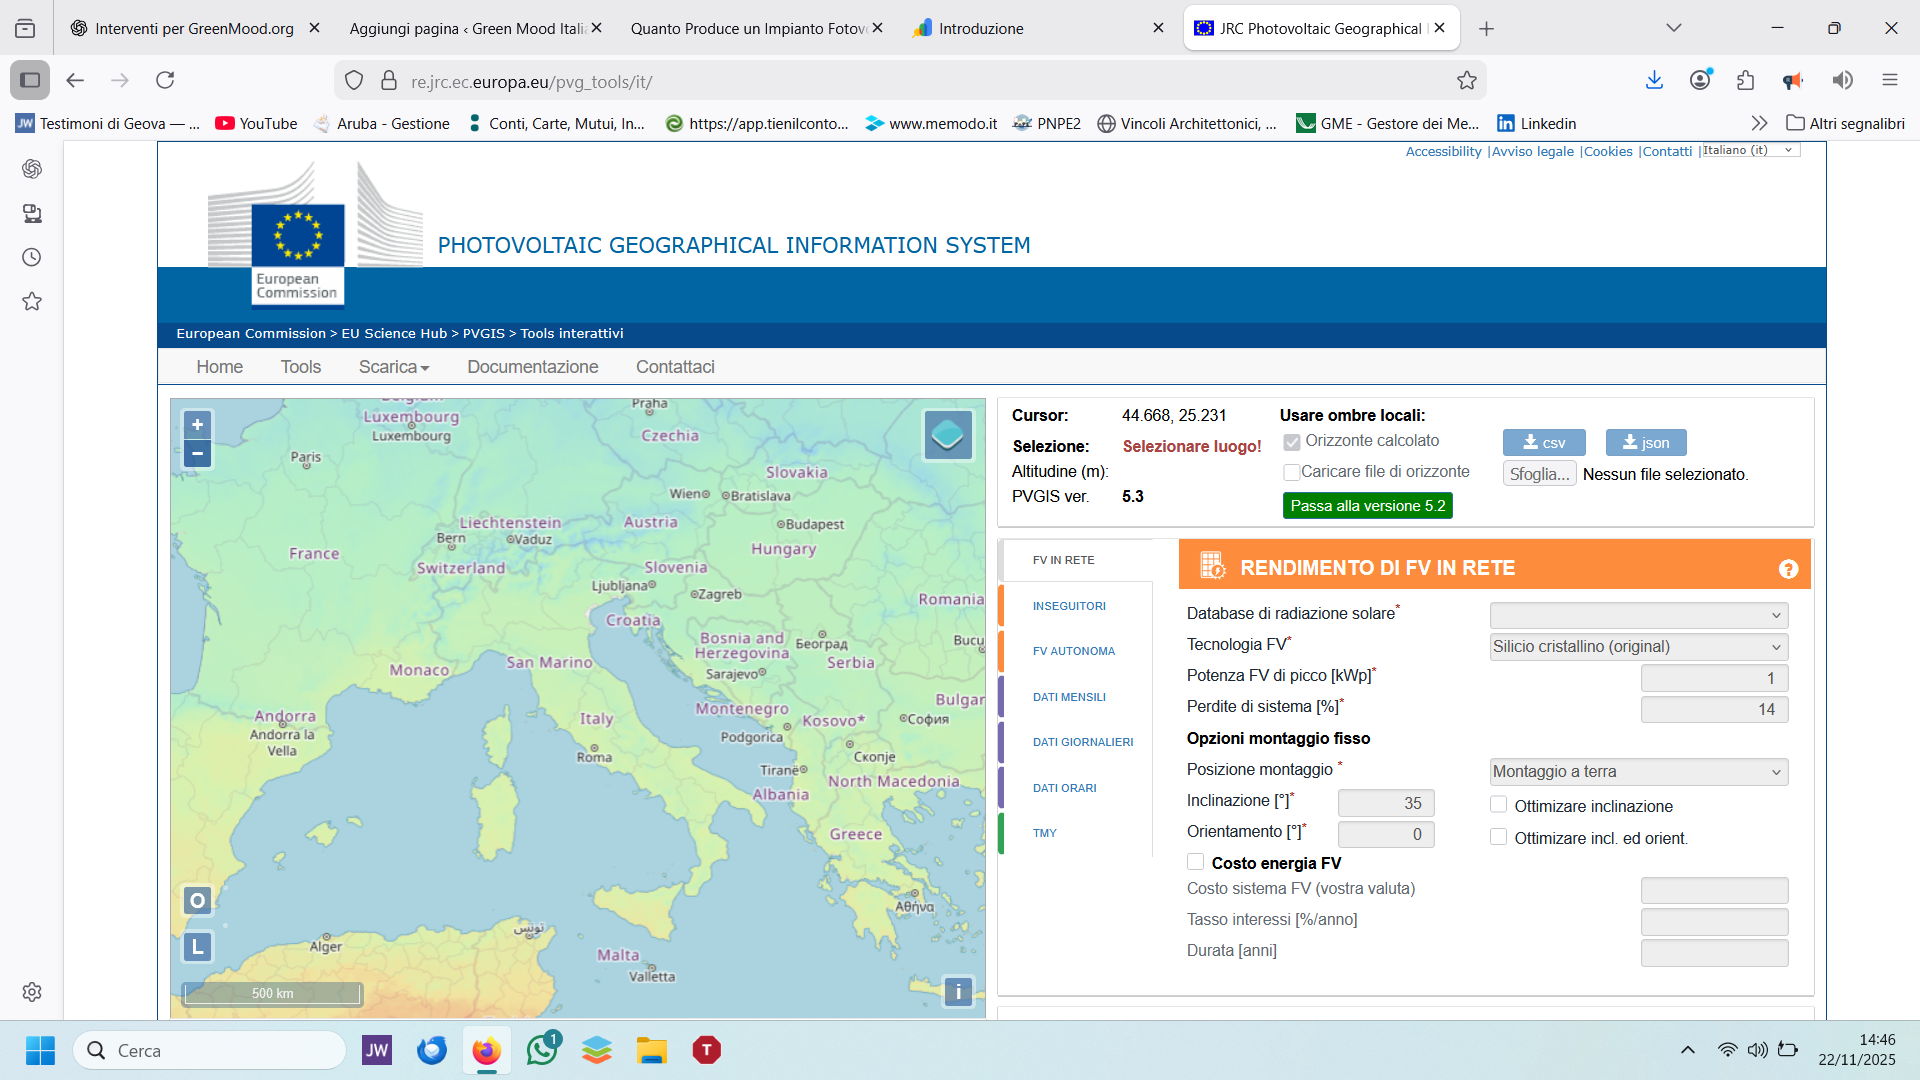
How to Calculate Your Solar Production Using PVGIS
PVGIS is the official solar simulation tool developed by the European Commission’s Joint Research Centre. It uses satellite-based climate data updated annually, which means its estimates are highly accurate even for individual homes and businesses. Because of its precision, PVGIS is widely used by professionals across Europe.
Official PVGIS link:
https://re.jrc.ec.europa.eu/pvgis/
📌 Step-by-step guide
1. Enter your full address.
Type your street, number and city. PVGIS will automatically pinpoint your home or business.
2. Click directly on your rooftop.
Zoom in and place the marker exactly where the solar panels would be installed. This increases accuracy substantially.
3. Enter the system size in kWp.
You can test 3, 6 or 10 kW, or any value you want—for example 4.5, 7 or even 15 kW.
4. Set the tilt (roof inclination).
If you are unsure, 30° is a good average for Italian rooftops.
5. Choose the azimuth (orientation).
0° = facing South (maximum efficiency)
-90° = East
90° = West
180° = North (not suitable)
6. Click “Calculate”.
PVGIS will instantly give you:
- • Annual production estimate
- • Monthly production chart
- • System losses (temperature, cables, inverter)
- • Specific yield (kWh per kWp)
7. Download the PDF report.
The full report includes graphs, technical losses and irradiation maps for your precise location.
Using PVGIS is extremely helpful because it allows you to compare different system sizes and understand exactly how much energy you can produce before investing. For this reason, we use PVGIS in every Green Mood Italia project and we encourage all customers to try it themselves.
Why Thousands of Clients Choose Green Mood Italia
Choosing the right company for your solar installation is essential because solar energy is a long-term investment. At Green Mood Italia, we manage the entire process from the initial site inspection to the final activation with Enel and the registration on the GSE portal. As a result, our clients enjoy a seamless, hassle-free experience with certified performance.
Moreover, we work only with premium N-TYPE modules and high-efficiency inverters, which provide superior long-term stability and resilience in hot climates. Additionally, all our installations include detailed PVGIS analysis, shading studies and lifetime performance forecasts to ensure that each project meets real-world expectations.
Get a Free PVGIS Analysis for Your Roof
Send us your address and energy bill, and we will calculate how much energy your solar system can produce using certified European Commission tools.
WhatsApp ➜ 327 4280245
What Customers Say About Us
Green Mood Italia is among the highest-rated solar providers in Italy, thanks to our attention to detail and full-service project management. Because we provide transparent documentation, certified components and accurate PVGIS analyses, clients appreciate both the clarity of our proposals and the long-term performance of the systems.
You can read verified reviews here:
Recensioni Green Mood Italia | Opinioni reali su Google ⭐⭐⭐⭐⭐
❓ Frequently Asked Questions (FAQ)
How much energy does a 3 kW solar system produce in Italy?
Typically between 3,200 and 4,800 kWh per year depending on orientation, shading and geographical location.
What about a 6 kW system?
A 6 kW system generally produces between 6,400 and 9,400 kWh annually, based on PVGIS simulations.
How much does a 10 kW system generate yearly?
It can generate between 10,500 and 15,500 kWh per year, with Southern Italy offering the highest performance.
Can I calculate my own production online?
Yes. You can use PVGIS to simulate your roof’s production with exact satellite climate data.
Is Green Mood Italia available nationwide?
Absolutely. We operate across the entire country with certified installers and complete project supervision.